Published ·By the InayaFlow team ·6 min read
TikTok Analytics: How to See and Read Your Stats (2026)
Where to find your TikTok analytics, what each tab and number means, and a weekly routine for reading them, with benchmarks from 213 channels.
TikTok analytics live in TikTok Studio: open your profile, tap the menu, choose TikTok Studio and open Analytics. TikTok's published tutorial names three tabs, Overview, Content and Followers, and our own Studio screens in November 2026 show more panels than that. Read them in one order: views first, then who watched, then what your best videos have in common.
Try it on your own account: type a TikTok username to see its engagement rate from its recent videos.
Engagement rate by views
—
Add your likes, comments, shares or saves.
Engagement rate by followers
—
Add your likes, comments, shares or saves.
Want to know why your TikTok numbers look like this?
Type your TikTok username and InayaFlow compares your own recent videos: your typical views, your engagement rate, what is working and what to post next. Free, no account or password needed.
Open the full TikTok engagement rate calculator.
Key takeaways
- TikTok Newsroom (2020): analytics sit behind a Pro account, and TikTok's tutorial names three tabs: Overview, Content and Followers. Newer versions of TikTok Studio show more, so follow the labels on your screen.
- TikTok Newsroom (2020): per video, TikTok shows total views, how long viewers watched, average watch time and audience traffic information.
- TikTok Newsroom (2020): TikTok advises reading the overall picture over time, not ranking one engagement number above the rest.
- Our 2026 dataset (213 channels): the median video got 280 views and the median engagement rate was 9.9% of views, with likes, comments and shares counted.
- Our dataset: saves are rare, at a median 0.38 per 100 views, so judge a save count against that, not against likes.
On this page
This page is the main guide in our analytics series. It covers where to look, what each number means, what normal looks like in our data, and a ten-minute weekly routine. For a drop in numbers, go to why your TikTok views are going down. For the full set of fixes, see how to get more views on TikTok.
TikTok analytics at a glance
| Question | Where to look | Source |
|---|---|---|
| How many people watched? | Overview: video views, profile views | TikTok's 2020 tutorial and our screens |
| Which videos work best? | Content tab: your videos, and the fastest-growing ones | TikTok's 2020 tutorial |
| Is my audience growing? | Followers tab: follower count over time | TikTok's 2020 tutorial and our screens |
| Where do views come from? | Overview: traffic source and search queries | Our screens (Nov 2026) |
| When are people online? | Followers and Viewers tabs: most active times | Our screens (Nov 2026) |
| How long did people watch? | Per-video analytics: average watch time | TikTok's 2020 tutorial |
How to see your TikTok analytics
On your phone
Open your profile, tap the menu, pick TikTok Studio, then open Analytics. TikTok's 2020 tutorial describes an older route: Settings and privacy, Manage my account, Switch to Pro Account, then the Pro Account page (TikTok Newsroom). Which one you see depends on your app version, so follow your own menu.
On a computer
The same tutorial says you can hover over your profile photo in the upper right and click View Analytics, and that on a computer you can also download and export your analytics. TikTok Studio on the web offers the same Analytics area.
A note on what we could and could not check
TikTok's current Help Center pages on analytics did not load for us, and the newest official walk-through we could read is from 2020. We describe the current layout only from screenshots of our own accounts, and we say so each time.
The Overview tab: your account in one screen
TikTok's tutorial describes the Overview as a high-level summary of account performance over time. It names total views (the number of times your videos were viewed), followers and profile views (the number of times your profile was viewed).
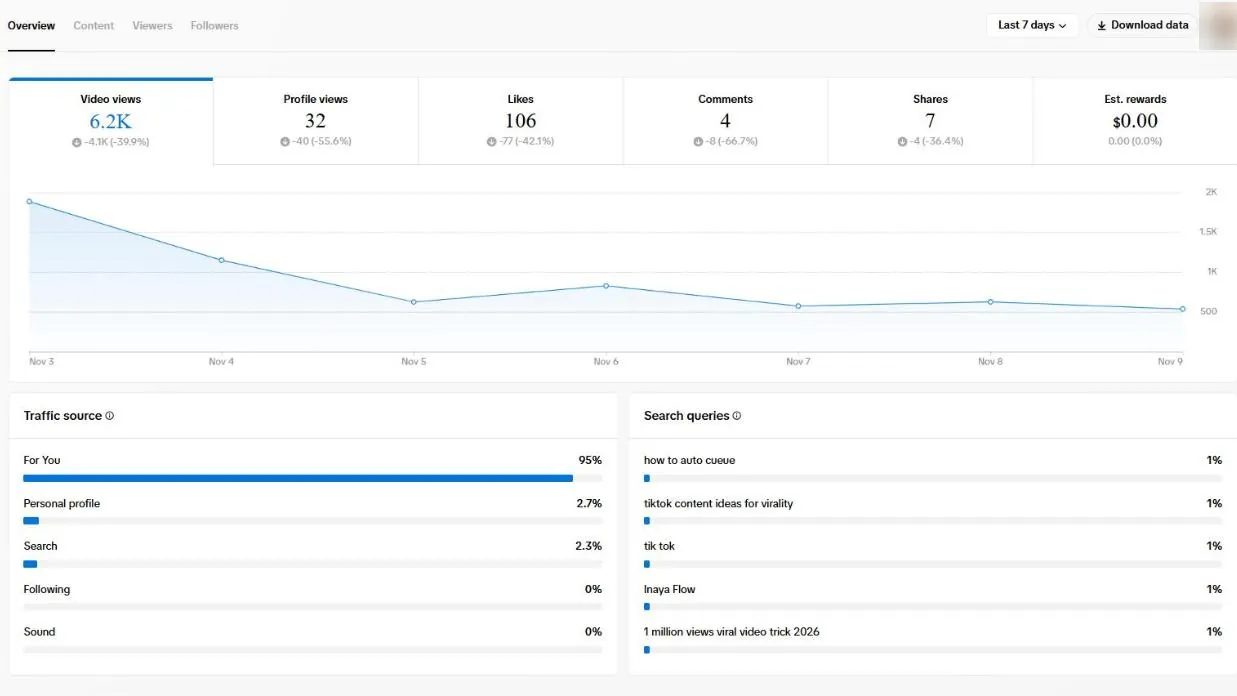
On our own screens in November 2026, the Overview also lists likes, comments and shares, a views chart, a traffic source panel and search queries. Look at the traffic source first. On the account in the screenshot, For You made up 95% of the traffic, which tells you the feed, not your followers, decided who saw those videos. A high For You share is what you expect when a video is being recommended to strangers.
The Content tab: which videos carry you
TikTok's tutorial says the Content tab lists your videos from the last seven days, newest first, and shows trending videos: the top nine videos with the fastest growth in views over the past seven days. This is where you find your pattern. Open your three best videos and your three weakest, and write down what differs: opening line, topic, length, sound.
Our data shows why you should expect a few outliers. In the 213 channels we studied, the single best video held a median 23% of its channel's views (InayaFlow study, 2026). So one video usually explains a large part of a channel's total, and the rest tell you about your normal.
Per-video analytics: watch time and traffic
For a single video, TikTok's tutorial lists how long viewers watched, total views, average watch time and audience traffic information. Watch time matters because TikTok says it factors into how a video gets recommended (TikTok Newsroom), and that finishing a longer video is a strong sign of interest (How TikTok recommends videos).
If two videos have the same views but one has a much longer average watch time, copy the longer one. That is the clearest signal TikTok gives you about the content itself.
The Followers tab: who is growing with you
TikTok's tutorial says the Followers tab shows follower count over time and growth trends, and that it covers likes, comments and shares across your videos too. Our screens add a total and net followers chart, a gender split and most active times by hour.
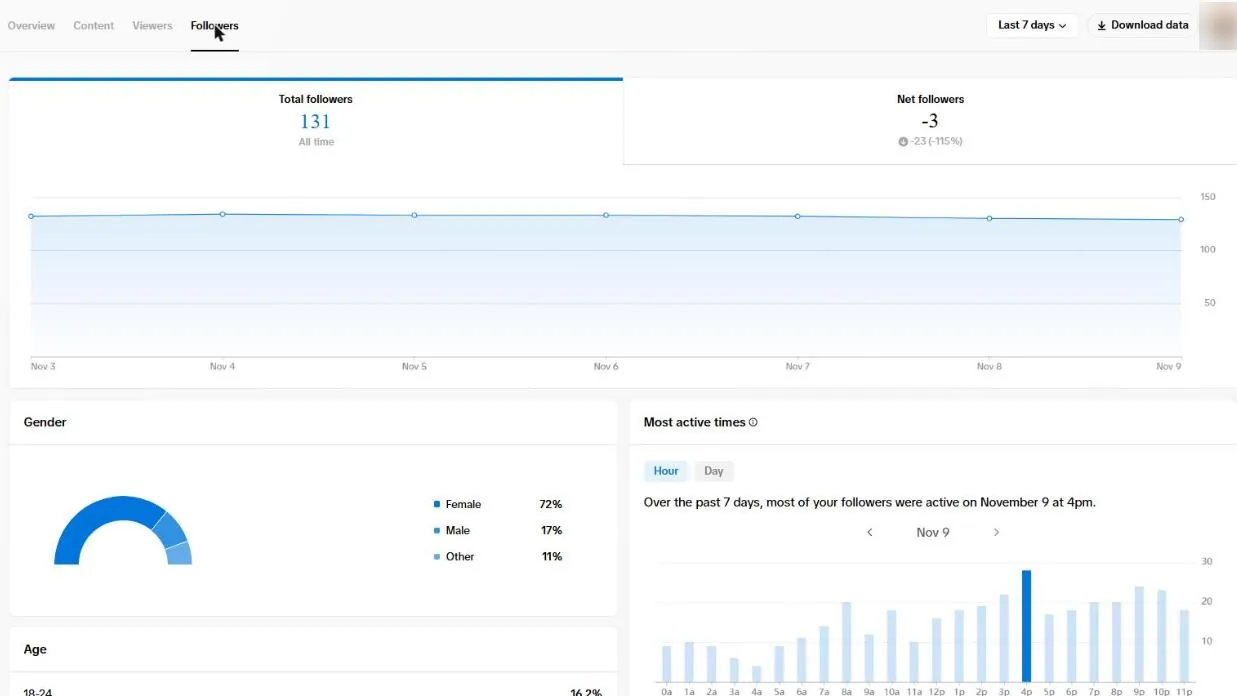
Use the most active times as a starting point for posting times, then test them. Reading them and testing a window is covered in best time to post on TikTok.
What the numbers mean: benchmarks from 213 channels
TikTok publishes no table of average numbers. These come from our own dataset of 213 channels and 3,422 videos, analyzed between June and November 2026 (InayaFlow study, 2026). They describe the accounts that ran a free analysis with us, not all of TikTok.
| Metric | 25th percentile | Median | 75th percentile |
|---|---|---|---|
| Views per video | 160 | 280 | 530 |
| Engagement rate (likes + comments + shares, divided by views) | 5.9% | 9.9% | 15.6% |
| Saves per 100 views | not reported | 0.38 | not reported |
Two readings follow. First, a video with 300 views is ordinary in this dataset, not a failure. Second, engagement rate is a ratio, so it can be high on a small video. To check your own, use the free engagement rate calculator.
How to read your analytics: a 10-minute weekly routine
- Pick a window. Use the last 28 days if the picker offers it, otherwise the last 7 days, and keep it the same each week.
- Write down three numbers: video views, profile views and net followers.
- Sort your videos by views. Mark the top three and the bottom three.
- Compare the two groups. Note the topic, the first line, the length and the sound.
- Check traffic source. If most views come from For You, the video itself is doing the work.
- Pick one change for next week, and change only that.
- Judge fairly. TikTok says results on a video keep arriving for about two days, so wait before you compare (TikTok Newsroom).
Common mistakes when reading TikTok analytics
- Reading one metric alone. TikTok warns against focusing on a single metric from video to video.
- Comparing a day-old video with a month-old one. Age changes the totals.
- Treating your best video as normal. Use medians, not your peak.
- Chasing followers over views. Views show whether the feed likes your content; followers lag behind. To turn views into followers, see how to get more followers on TikTok.
- Expecting analytics to say what to post. They report what happened. The next idea still has to come from you.
How InayaFlow works alongside TikTok analytics
TikTok Studio is the source of the raw numbers, and it is free. InayaFlow takes the counts anyone can see on your videos (views, likes, comments, shares, saves) plus the spoken words where a transcript exists, and writes up what stands out.
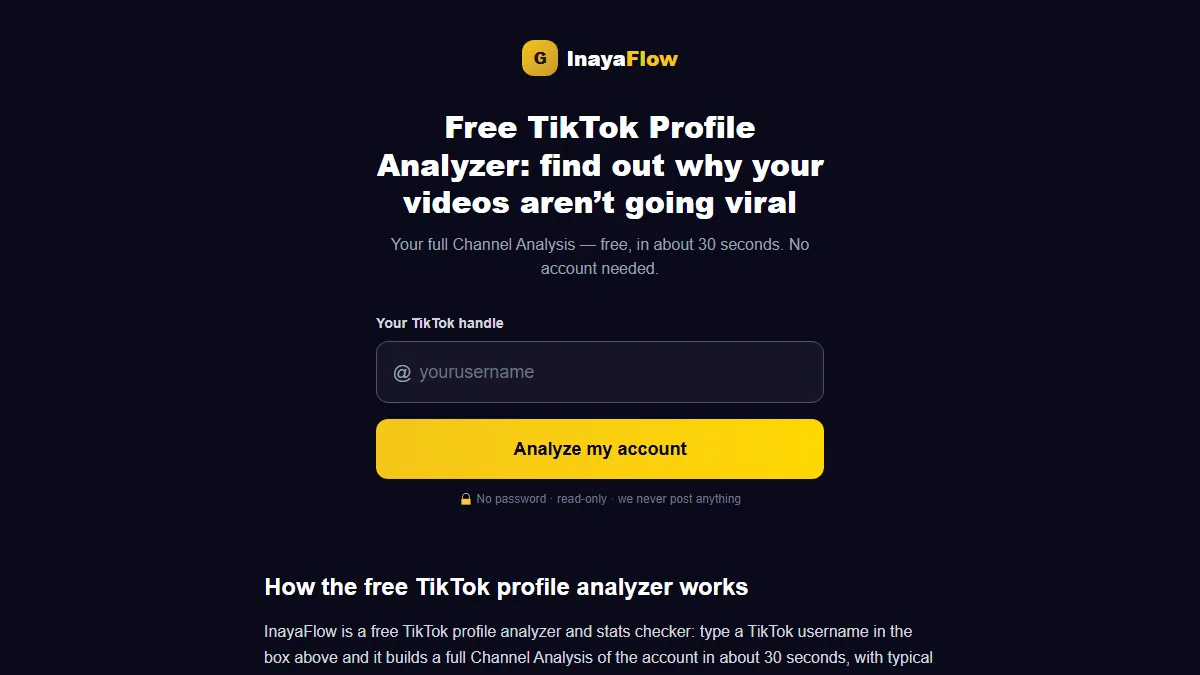
Type your handle at inayaflow.ai/analyze and, without signing up, you get a Channel Analysis in about 30 seconds: niche, strengths, weaknesses and three recommendations. Pro adds Video Analysis, where you paste a single video and get a read on its result, and Best Posting Times, which ranks eight 3-hour windows for each weekday using your own top videos. Watch time, retention and completion rate are outside what it reads; TikTok Studio is the place for those. Posting stays with you.
TikTok analytics checklist
- I know where Analytics is in my version of TikTok Studio.
- I read the traffic source before the follower count.
- I compared my top three and bottom three videos.
- I used the median of my last 10 videos, not my best.
- I changed only one thing for the next video.
- I waited about two days before judging a new upload.
Want a second read on your channel? Run the free TikTok channel analysis. To turn your numbers into a rate, use the engagement rate calculator.
Frequently asked questions
Where do I find my TikTok analytics?
On the phone, open your profile, tap the menu and choose TikTok Studio, then open Analytics. On a computer, TikTok Studio is on the web. TikTok's 2020 tutorial describes the older route through the Pro Account page in Settings and privacy. Menu names change between versions, so follow the labels you see.
Do I need a business account to see TikTok analytics?
TikTok's 2020 tutorial says analytics required switching to a Pro Account, found under Manage my account. Newer app versions may differ, and we could not load TikTok's current Help Center page to confirm, so check Settings on your own account.
What is a good engagement rate on TikTok?
In our 2026 dataset of 213 channels, the middle channel had an engagement rate of 9.9% of views, with the middle half between 5.9% and 15.6%. That counts likes, comments and shares divided by views. Other tools define the rate differently, so compare like with like.
Which TikTok metric matters most?
TikTok's tutorial advises reading the overall picture over time rather than ranking one engagement number above the rest. In practice, compare your own videos with each other on views first, then on shares, comments and saves.
Can I see who viewed my TikTok videos?
TikTok's published tutorial covers aggregate numbers such as total views, audience traffic and follower trends. It does not describe a list of individual viewers, and we do not claim one exists.
Does InayaFlow replace TikTok analytics?
No. TikTok Studio holds the raw numbers. InayaFlow turns the public counts and the spoken words into a plain-language read of your channel. It has no watch time, retention or completion data.
Sources
- TikTok Newsroom: Product tutorial: TikTok Analytics (August 14, 2020)
- TikTok Newsroom: 5 tips for TikTok creators (July 30, 2020)
- TikTok Newsroom: How TikTok recommends videos #ForYou (June 18, 2020)
- InayaFlow: TikTok benchmarks study 2026 (213 channels) (November 10, 2026)